Cisco T-Rex
yet another wonderful cisco product
I kid. T-Rex is actually pretty cool.
I’m writing a post right now about the NanoPi R5S.
All the other reviews / benchmarks (including those from friendlyelec) I’ve seen on these have been uh… Kinda useless (no offense to those authors).
They’re routers, we care about how much traffic they can pass, not how much they can ingest/generate.
Anyway, getting off topic, back to t-rex itself.
![]()
So. T-Rex is a pretty cool suite.
Out of the box it has several traffic profiles which cover most of what I want to test on these little guys.
I might cook some profiles of my own, cs:go gameserver traffic would be interesting to test.
Profiles are basically pcaps to replay and a yaml to define how they’re replayed. Pretty simple.
dpdk pain
My hardware is an Optiplex 7040 with a 4-port Intel i350 card.
The chipset is listed on the supported list for t-rex, so I thought it’d all be good.
I load up derpbian, download the thing, install the deps, and try to run it….
Only… no traffic is actually passed over the loopback… dmesg is flooded with dmar errors… sigh
I tried a few iommu kernel params that had resolved dmar errors in the past without much luck. It looked like this was a versioning problem with dpdk stuff. RIP me.
striking a deal with the devil
Centos it is. I find a 7.6 iso at vault.centos.org and install that.
Now it works, and I spent some time messing around with the many parameters of trex.
At this point I’m working with a hardware loopback (port 0 is connected to port 2 with a short patch cable).
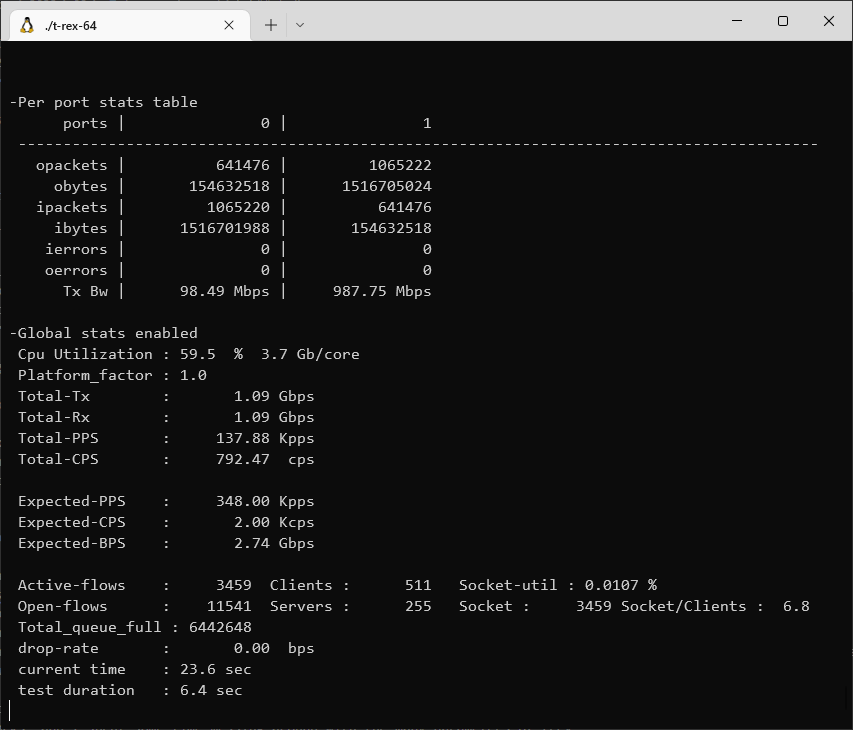
./t-rex-64 -f cap2/https.yaml -m 1000 -d 30
I think I’m doing this right…
must. go. faster.
I am able to run a number of tests that saturate the phy bandwidth, but some others are cpu bottlenecked (smol packets, lots of simulated client/servers, etc).
Given that this box has some i5 in it with 4c/4t, a cpu upgrade felt natural.
Some googling told me that the i7-6700K would work on my 7040. It has 4c/8t at 4.0 ~ 4.2ghz.
Not bad.
While I wait for that to show up let’s play with trex more and see if I can get some graphable output from it.
It was at this point I discovered that “stateful” mode was basically deprech, and I should be using “ASTF” mode instead.
ASTF is basically stateful but instead of yaml and local running, you run a daemon in astf mode and connect to it over zmq.
There’s only one library to make this sane… And it’s in python.
This however turned out to be not too horrible in the end.
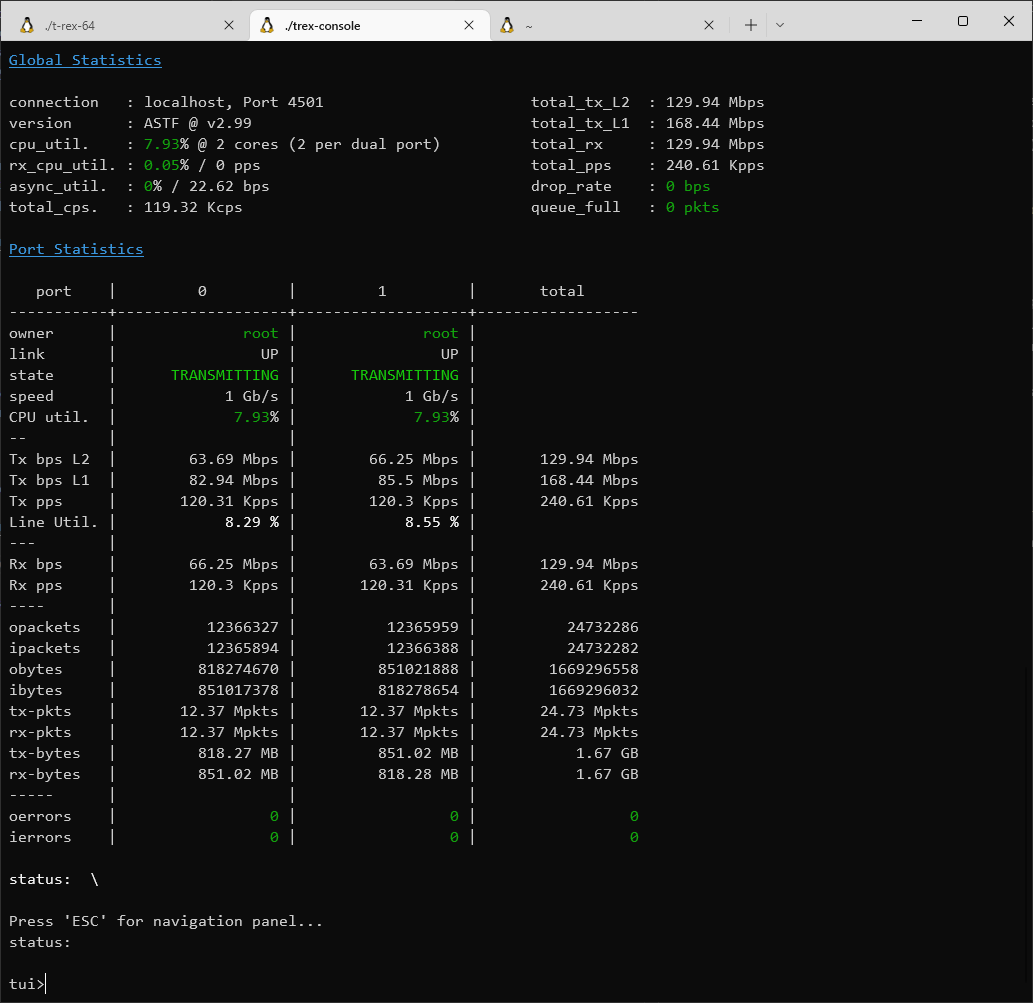
trex-console has a cute tui mode
down the rabbit hole we go
Bit more googling lead me to this: astf_example.py
I can kinda work with this. If I can get those stats on some interval…
while c.is_traffic_active():
      stats = c.get_stats()
      timestamp = time.mktime(datetime.datetime.now().timetuple()) * 1000
      statsArray.append(JsonOutput(timestamp, stats))
      time.sleep(0.5)
outputFile = open(outputPath, "w")
outputFile.write(json.dumps(statsArray, default=vars))
:neat:
Don’t judge my dogshit python abilities
I think I got the math right when I modified that function…
It ain’t matter though b/c that’s just for my human-readable while the test is running
time to make it clean
Before making graphs I wanted to isolate and repo-ize my work so far.
This ended up being a lot harder than it should have been.
I’m probably violating licenses, but whatever, this is nonprofit.
graphs, glorious graphs
Now to figure out how to make pretty graphs with all this data.
It didn’t take too long to get something with chart.js and canvas working.
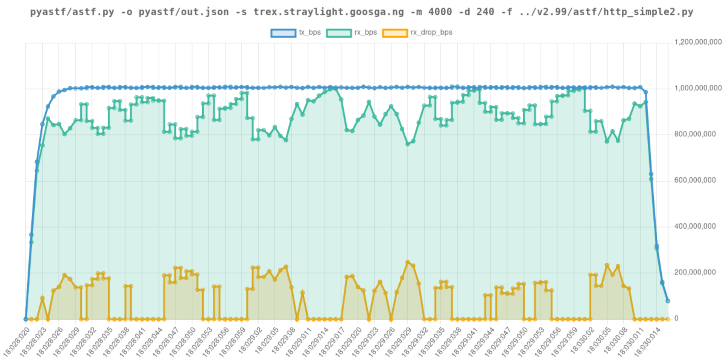
Ugly, for now.
After a fair amount of farting around with graph params and other small things, I had myself a lil nodejs (yes, js. yes, the actual api is in python. no I will not be answering your questions at this time.) blob that would take a hjson file of profiles and settings to run and generate graphs for, and like, run it.
The way I ended up doing it was gross at every step. But. It works.
Feelsgood.
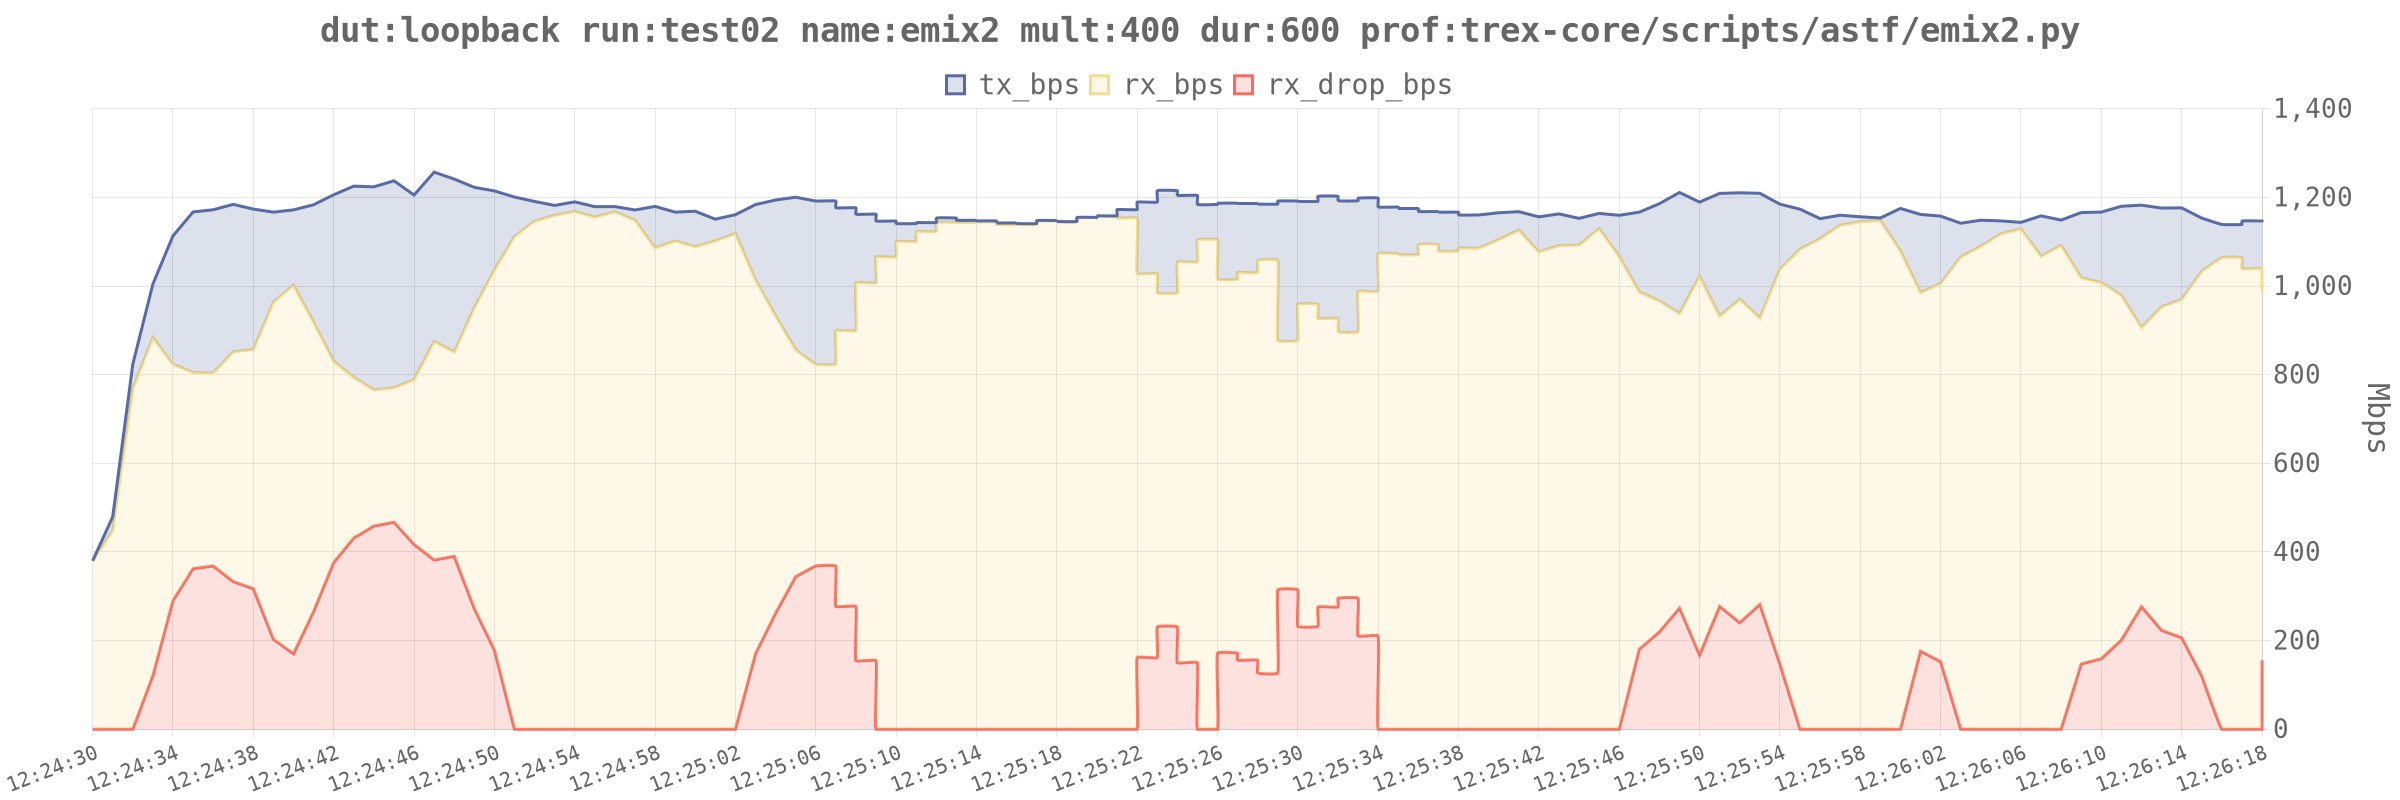
The emix2 profile is killer.
full json stats here
As you can see (I’m assuming you clicked the json link), there’s plenty of stats that I’m not even looking at yet.
next steps
I’ve bundled up all the code used in this post in this repo.
Do with it what you will. I only ask that if you use this in a commercial product, you give me a free copy. Otherwise I’m going to pirate it.
I still need to run a suite of profiles through loopback to determine the “best” parameters for each given my test hardware.
After that I can actually run some repeatable tests on a real device!
It’d be neat to add a realtime graph in the cli, test duration progress bars, etc.
Maybe I’ll do that later today… Keep an eye on that repo for changes.
Oh, and I have that new cpu on the way!
I’ll probably do a part 2 with finalized benchmark sets when that comes in.