Cisco T-Rex: Further down the rabbit hole...
why not just learn python dude….
Because I can’t stand it, that’s why.
Plus I really do like nodejs.
Plus everything Cisco has provided is an absolute mess.
I’m already doing my graphing and analysis in js, and I’m thinking now it’d be Really Cool to have a webui of some sort in the future.
The zmq rpc documetation is pretty accurate. There’s a few gaps but nothing too horrible.
the library
https://github.com/velocipacktor/jsrex
Here’s the node lib for the t-rex zmq server. There’s a few examples under the examples/ directory,
I’m going to move them into their own repo soon though (will updoot this post with a link).
the conversion tool
All the sample ASTF profiles that Cisco provides are in python. This is great and all because the JSON format is pure aids to read, but I do need the profile in json format in order to run it with my js tooling.
The python lib “compiles” the profile template into json before submitting it to the t-rex server.
The bad news here is that replicating the json conversion ourselves would be a Lot of work.
Thankfully the ASTFTemplate class in the python lib actually exposes a to_json_str() function that we can just call.
It took some googling and playing around but I was able to get it working in a reasonable amount of time.
The resulting conversion ended up looking like this:
module = importlib.import_module(file, package='./')
profile = module.register().get_profile('')
profile.to_json_str()
There’s a howto in the repo
making some graphs
It was easier to capture data now that everything was being done in one process.
I started to rewrite my benchmark sequencer to make use of jsrex.
I added the ability to load profile templates as es6 imports, native t-rex json, and as python templates.
That last one was important as there are a lot of sample templates provided by Cisco that I want to be able to easily use.
In the short/mid term it’ll also be easier for me to cook my own profiles in python - the python lib has a lot of helper functions to build the profile.
from trex_stl_lib.api import *
import argparse
class STLS1(object):
  def create_stream (self, src_addr, dst_addr, size, load):
    return STLStream(
      packet =
          STLPktBuilder(
            pkt = Ether()/IP(src=src_addr,dst=dst_addr)/
                UDP(dport=12,sport=1025)/(size*'x') # build packets filled with 'size * x'
          ),
      # fill the pipe
       mode = STLTXCont( percentage = load / 4 ))

  def get_streams (self, tunables, **kwargs):
    parser = argparse.ArgumentParser(description='Argparser for {}'.format(os.path.basename(__file__)),
                     formatter_class=argparse.ArgumentDefaultsHelpFormatter)
    parser.add_argument('--load',
              type=int,
              default=64,
              help="""define how much to load the link.""")
    parser.add_argument('--size',
              type=int,
              default=64,
              help="""define the packet's size in the stream.""")
    args = parser.parse_args(tunables)
    # create 4 streams
    return [
      self.create_stream("16.0.0.1", "48.0.0.1", args.size, args.load),
      self.create_stream("16.0.0.2", "48.0.0.2", args.size, args.load),
      self.create_stream("16.0.0.3", "48.0.0.3", args.size, args.load),
      self.create_stream("16.0.0.4", "48.0.0.4", args.size, args.load),
    ]
# dynamic load - used for trex console or simulator
def register():
  return STLS1()
nice documentation
I then discovered some documentation on how the simulation tools can just. Print the json for me.
^f “Adding –json displays the details of the JSON profile”
^f “Adding –json displays the details of the JSON command for adding a stream”
So. Cool. Glad I found that just now. Glad I spent the time digging into the python api figuring out how to print the json from a py profile.
Guess I can archive the pyastf-json-convertor repo and just call those commands from my benchmarking tools.
Doing this proved somewhat problematic, I ended up needing to use node-pty… Might rewrite to pipe the convertor stdout to readline.
Keep an eye on this repo.
digging myself in even deeper
The thought hit me - browsers can’t zmq. So I need a http gateway to t-rex if I want a webui. Fun.
Enter stage left: velocipacktor.
What is it? Right now it’s a very minimal http control interface for t-rex.
It can:
- Start t-rex in stl or astf mode
- Stop t-rex
- See if t-rex is running
In the future, I hope it can:
- provide a feature complete api for the t-rex zmq api
- have websocket endpoints for streaming realtime stats
- expose a webui with live graphs
Writing a http gateway does make sense though. It’s easier to proxy and authenticate http/s than zmq, for one thing.
Dockerizing the whole stack and having a cute webui will lower the barrier to entry of t-rex (it’s a good thing).
how fast is fast enough?
I have a lot of work to do on velocipacktor still. But, in its current state, I can generate repeatable benchmarks and graphs and such.
I now need to see what my test bench hardware is capable of.
Hardware:
- Chassis:    Dell Optiplex 7040
- CPU:        Intel i7-6700k
- RAM:        8GB DDR4 2133
- NIC:        Intel X710-DA2 (yep, I got the one that goes to 11)
- DUT:        6in twinax sfp+ DAC (loopback between the two ports)
Using udp_linerate_4_streams.py, I am able to saturate the interface with ease at any packet size.
This post goes into detail on the math behind what “line rate” actually is.
I can say with some confidence that this card in this system is capable of doing line rate with 64b on-wire packets:
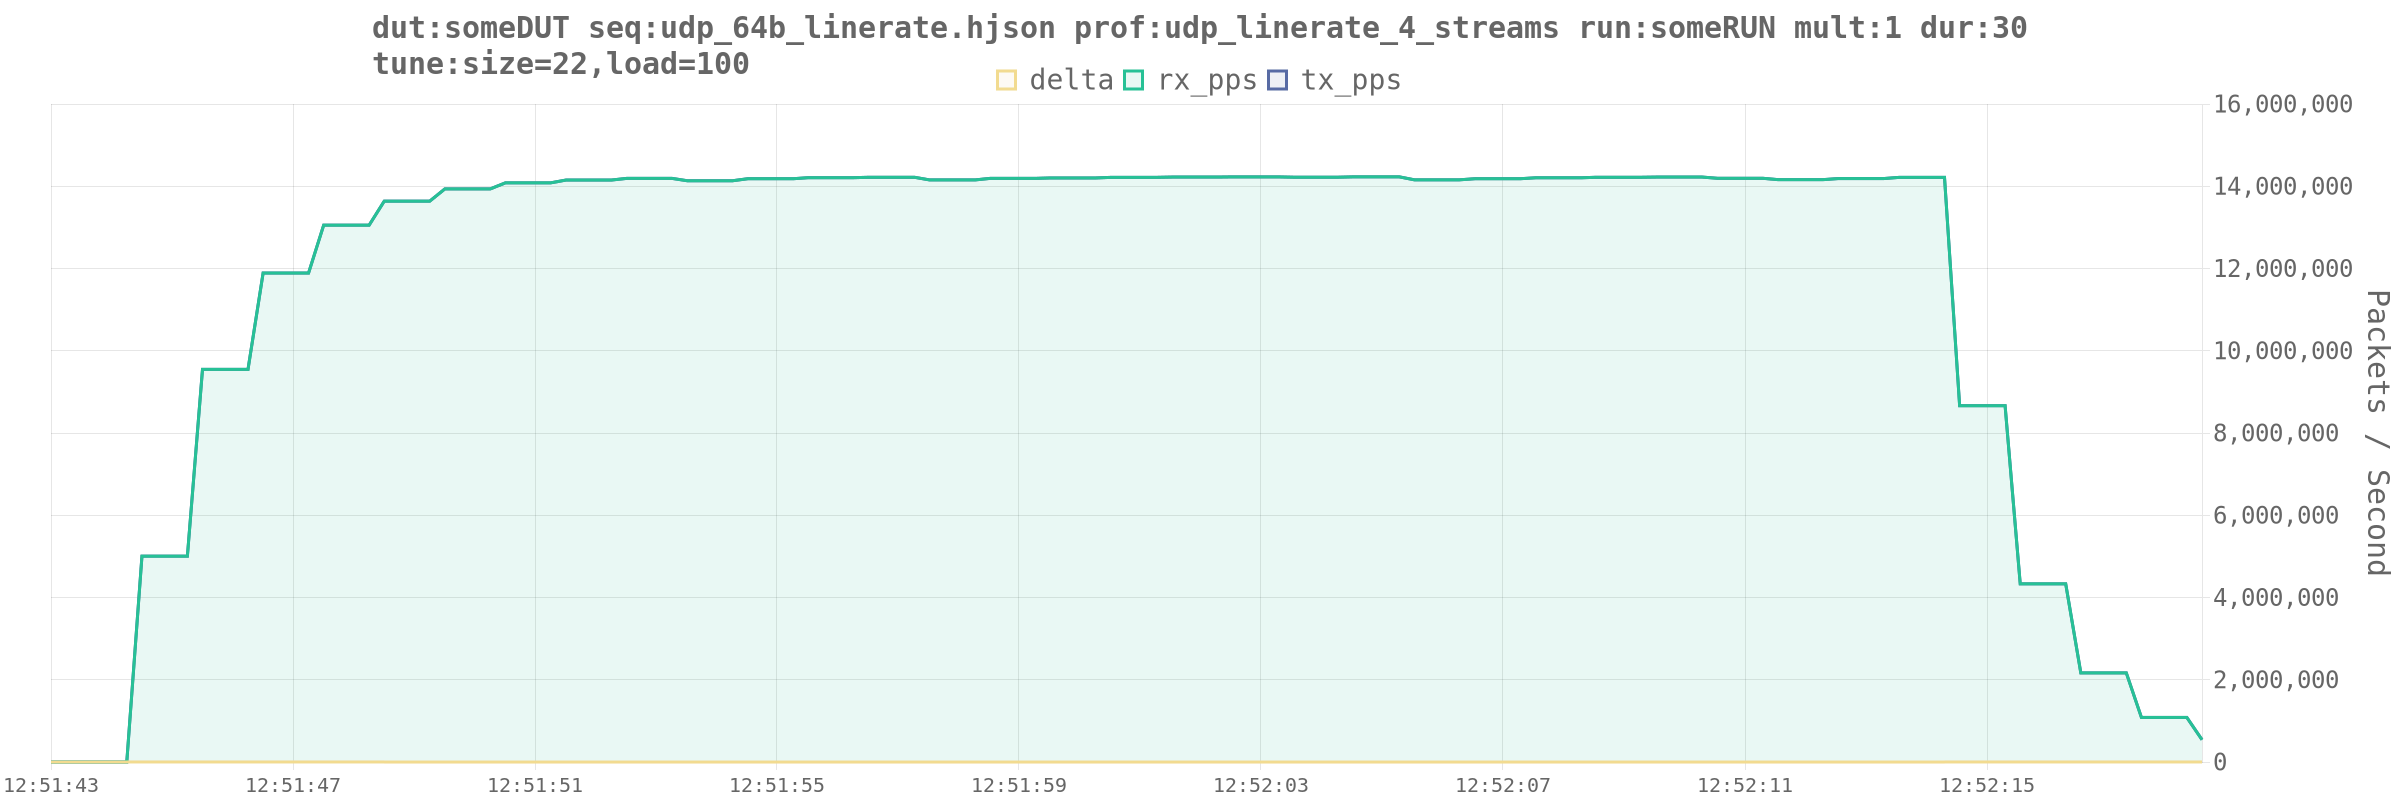
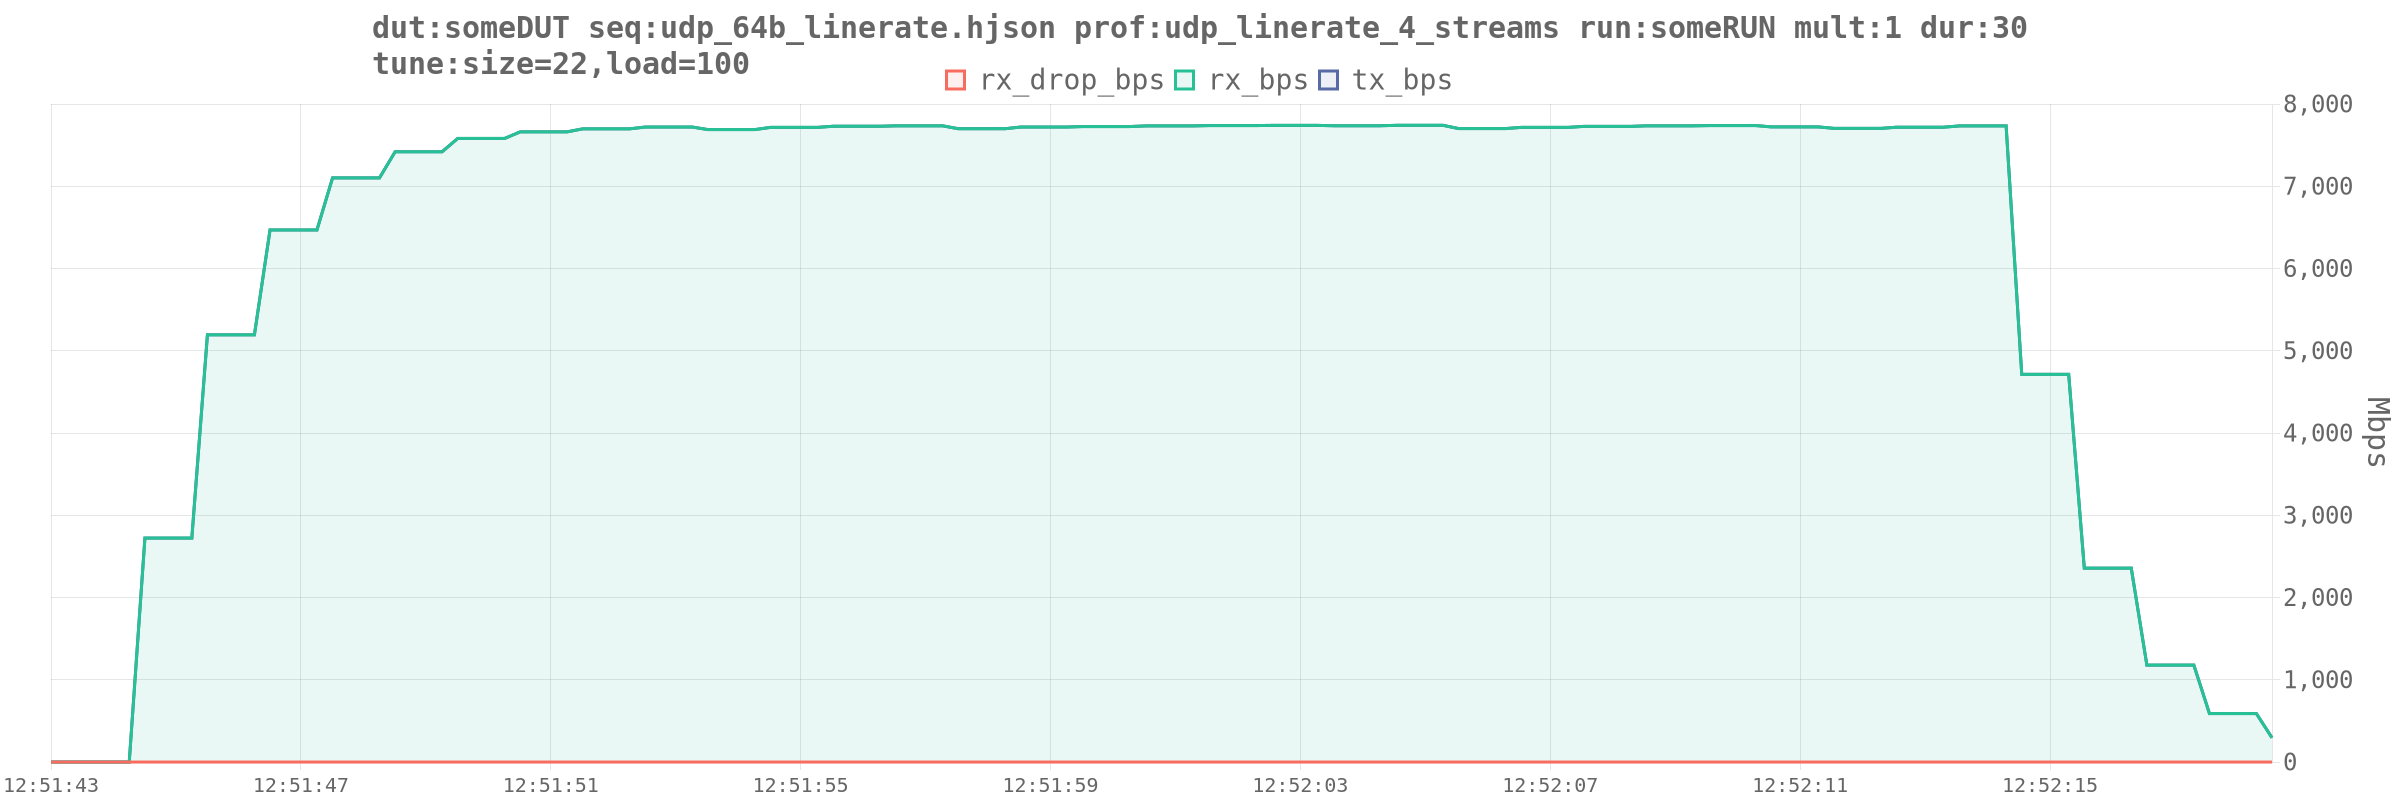
Given that all my current DUTs are 1gig and 2.5gig that’s more than good enough.
I haven’t tested the rj45 sfp+ modules yet, but I don’t forsee any issues with them.
And that’s where I’ll leave this one off for now.
Stay tuned, there will be more.